This page contains example content for previewing or demonstrating computational content and notebooks, as well as Thebe integration.
Pandas
The following cell shows the output of a scrollable table.
import pandas as pd
import numpy as np

df = pd.DataFrame(np.random.randn(10, 26), columns=['A', 'B', 'C', 'D', 'E', 'F', 'G', 'H', 'I', 'J', 'K', 'L', 'M', 'N', 'O', 'P', 'Q', 'R', 'S', 'T', 'U', 'V', 'W', 'X', 'Y', 'Z'])
# Here we'll just display the first few columns, we demonstrate wide tables below
df.iloc[:, :5]Matplotlib
import matplotlib.pyplot as plt

plt.figure(figsize=(10, 6))
plt.scatter(df['A'], df['B'], alpha=0.7)
plt.xlabel('Column A')
plt.ylabel('Column B')
plt.title('Scatter Plot of DataFrame Columns')
plt.grid(True, alpha=0.3)
plt.show()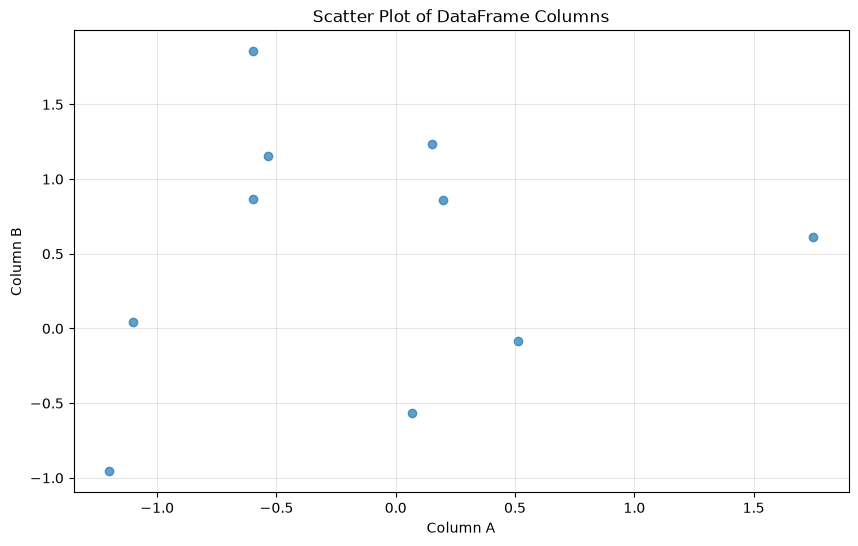
Plotly
import plotly.express as px

fig = px.scatter(df, x='A', y='B', title='Interactive Scatter Plot with Plotly')
fig.update_layout(
    xaxis_title='Column A',
    yaxis_title='Column B',
    showlegend=False
)
fig.show()Altair
import altair as alt

chart = alt.Chart(df.reset_index()).mark_circle().encode(
    x=alt.X('A:Q', title='Column A'),
    y=alt.Y('B:Q', title='Column B'),
    tooltip=['index', 'A', 'B']
).properties(
    title='Interactive Chart with Altair',
    width=400,
    height=300
)

chartBokeh
from bokeh.plotting import figure, show
from bokeh.io import output_notebook

# Configure Bokeh to display plots inline
output_notebook()

# Create the plot
p = figure(width=400, height=300, title='Interactive Scatter Plot with Bokeh')
p.scatter(df['A'], df['B'], size=8, alpha=0.7, color='navy')

# Customize the plot
p.xaxis.axis_label = 'Column A'
p.yaxis.axis_label = 'Column B'
p.grid.grid_line_alpha = 0.3

show(p)Text outputs
A simple cell with printed text output for comparison with error outputs below:
print("Hello, world!")
print("Result:", 2 + 3)
Hello, world!
Result: 5
A simple cell with ANSI codes, such as color, emphasis, etc. This uses a restricted palette, which is designed for maximum readability at the expense of styling richness. For example, dim and bright styles are disabled, and only foreground colours are used. Background colours are remapped to the foreground:
colour_palette = (
    f"\033[38;5;140mEveryone with \033[31;1;4mtelekinetic powers\033[0m\033[38;5;140m, raise \033[31;1;1mmy\033[0m \033[31;1;3mhand\033[0m.\033[0m. \033[31;1;2mDim\033[0m"
)
colours_named = "\n".join((f"\033[38;5;{i}mMeep\033[0m" for i in range(16)))
print(colour_palette)
print(colours_named)
Everyone with telekinetic powers, raise my hand.. Dim
Meep
Meep
Meep
Meep
Meep
Meep
Meep
Meep
Meep
Meep
Meep
Meep
Meep
Meep
Meep
Meep
there are separate styles for the stderr stream:
import sys

print(colour_palette, file=sys.stderr)
print(colours_named, file=sys.stderr)
Everyone with telekinetic powers, raise my hand.. Dim
Meep
Meep
Meep
Meep
Meep
Meep
Meep
Meep
Meep
Meep
Meep
Meep
Meep
Meep
Meep
Meep
We can also set the full-color-output class to show raw colors. Unlike the earlier example, raw colors include the full 8-bit ANSI palette, dim and bright styles, and both foreground and background colors:
import sys

print(colour_palette)
print(colours_named)
Everyone with telekinetic powers, raise my hand.. Dim
Meep
Meep
Meep
Meep
Meep
Meep
Meep
Meep
Meep
Meep
Meep
Meep
Meep
Meep
Meep
Meep
and the corresponding class full-color-error for stderr, too.
import sys

print(colour_palette, file=sys.stderr)
print(colours_named, file=sys.stderr)
Everyone with telekinetic powers, raise my hand.. Dim
Meep
Meep
Meep
Meep
Meep
Meep
Meep
Meep
Meep
Meep
Meep
Meep
Meep
Meep
Meep
Meep
Error outputs
You can use the raises-exception cell tag to indicate that a code cell is expected to error.
This will display the error output but continue executing the rest of the notebook.
We use a semi-complex function with a traceback error to test out all the various types of error classes and make sure they show up properly:
from pathlib import Path

class DataLoader:
    """Loads data from a file path."""

    # A comment about this function!
    @staticmethod
    def load(path: str, limit: int = 10) -> list:
        data = Path(path).read_text()
        return data.split("\n")[:limit]

DataLoader.load(42)
---------------------------------------------------------------------------
TypeError Traceback (most recent call last)
Cell In[11], line 12
8 def load(path: str, limit: int = 10) -> list:
9 data = Path(path).read_text()
10 return data.split("\n")[:limit]
11
---> 12 DataLoader.load(42)
Cell In[11], line 9, in DataLoader.load(path, limit)
7 @staticmethod
8 def load(path: str, limit: int = 10) -> list:
----> 9 data = Path(path).read_text()
10 return data.split("\n")[:limit]
File ~/.local/share/mise/installs/python/3.12.13/lib/python3.12/pathlib.py:1162, in Path.__init__(self, *args, **kwargs)
1159 msg = ("support for supplying keyword arguments to pathlib.PurePath "
1160 "is deprecated and scheduled for removal in Python {remove}")
1161 warnings._deprecated("pathlib.PurePath(**kwargs)", msg, remove=(3, 14))
-> 1162 super().__init__(*args)
File ~/.local/share/mise/installs/python/3.12.13/lib/python3.12/pathlib.py:373, in PurePath.__init__(self, *args)
371 path = arg
372 if not isinstance(path, str):
--> 373 raise TypeError(
374 "argument should be a str or an os.PathLike "
375 "object where __fspath__ returns a str, "
376 f"not {type(path).__name__!r}")
377 paths.append(path)
378 self._raw_paths = paths
TypeError: argument should be a str or an os.PathLike object where __fspath__ returns a str, not 'int'We can also set the full-color-error class to show raw colours:
from pathlib import Path

class DataLoader:
    """Loads data from a file path."""

    # A comment about this function!
    @staticmethod
    def load(path: str, limit: int = 10) -> list:
        data = Path(path).read_text()
        return data.split("\n")[:limit]

DataLoader.load(42)
---------------------------------------------------------------------------
TypeError Traceback (most recent call last)
Cell In[12], line 12
8 def load(path: str, limit: int = 10) -> list:
9 data = Path(path).read_text()
10 return data.split("\n")[:limit]
11
---> 12 DataLoader.load(42)
Cell In[12], line 9, in DataLoader.load(path, limit)
7 @staticmethod
8 def load(path: str, limit: int = 10) -> list:
----> 9 data = Path(path).read_text()
10 return data.split("\n")[:limit]
File ~/.local/share/mise/installs/python/3.12.13/lib/python3.12/pathlib.py:1162, in Path.__init__(self, *args, **kwargs)
1159 msg = ("support for supplying keyword arguments to pathlib.PurePath "
1160 "is deprecated and scheduled for removal in Python {remove}")
1161 warnings._deprecated("pathlib.PurePath(**kwargs)", msg, remove=(3, 14))
-> 1162 super().__init__(*args)
File ~/.local/share/mise/installs/python/3.12.13/lib/python3.12/pathlib.py:373, in PurePath.__init__(self, *args)
371 path = arg
372 if not isinstance(path, str):
--> 373 raise TypeError(
374 "argument should be a str or an os.PathLike "
375 "object where __fspath__ returns a str, "
376 f"not {type(path).__name__!r}")
377 paths.append(path)
378 self._raw_paths = paths
TypeError: argument should be a str or an os.PathLike object where __fspath__ returns a str, not 'int'Embedding a full-color cell loses the annotation:
---------------------------------------------------------------------------
TypeError                                 Traceback (most recent call last)
Cell In[12], line 12
      8     def load(path: str, limit: int = 10) -> list:
      9         data = Path(path).read_text()
     10         return data.split("\n")[:limit]
     11
---> 12 DataLoader.load(42)

Cell In[12], line 9, in DataLoader.load(path, limit)
      7     @staticmethod
      8     def load(path: str, limit: int = 10) -> list:
----> 9         data = Path(path).read_text()
     10         return data.split("\n")[:limit]

File ~/.local/share/mise/installs/python/3.12.13/lib/python3.12/pathlib.py:1162, in Path.__init__(self, *args, **kwargs)
   1159     msg = ("support for supplying keyword arguments to pathlib.PurePath "
   1160            "is deprecated and scheduled for removal in Python {remove}")
   1161     warnings._deprecated("pathlib.PurePath(**kwargs)", msg, remove=(3, 14))
-> 1162 super().__init__(*args)

File ~/.local/share/mise/installs/python/3.12.13/lib/python3.12/pathlib.py:373, in PurePath.__init__(self, *args)
    371             path = arg
    372         if not isinstance(path, str):
--> 373             raise TypeError(
    374                 "argument should be a str or an os.PathLike "
    375                 "object where __fspath__ returns a str, "
    376                 f"not {type(path).__name__!r}")
    377         paths.append(path)
    378 self._raw_paths = paths

TypeError: argument should be a str or an os.PathLike object where __fspath__ returns a str, not 'int'But we can restore it with a full-color-error class in a wrapping div or figure.
---------------------------------------------------------------------------
TypeError                                 Traceback (most recent call last)
Cell In[12], line 12
      8     def load(path: str, limit: int = 10) -> list:
      9         data = Path(path).read_text()
     10         return data.split("\n")[:limit]
     11
---> 12 DataLoader.load(42)

Cell In[12], line 9, in DataLoader.load(path, limit)
      7     @staticmethod
      8     def load(path: str, limit: int = 10) -> list:
----> 9         data = Path(path).read_text()
     10         return data.split("\n")[:limit]

File ~/.local/share/mise/installs/python/3.12.13/lib/python3.12/pathlib.py:1162, in Path.__init__(self, *args, **kwargs)
   1159     msg = ("support for supplying keyword arguments to pathlib.PurePath "
   1160            "is deprecated and scheduled for removal in Python {remove}")
   1161     warnings._deprecated("pathlib.PurePath(**kwargs)", msg, remove=(3, 14))
-> 1162 super().__init__(*args)

File ~/.local/share/mise/installs/python/3.12.13/lib/python3.12/pathlib.py:373, in PurePath.__init__(self, *args)
    371             path = arg
    372         if not isinstance(path, str):
--> 373             raise TypeError(
    374                 "argument should be a str or an os.PathLike "
    375                 "object where __fspath__ returns a str, "
    376                 f"not {type(path).__name__!r}")
    377         paths.append(path)
    378 self._raw_paths = paths

TypeError: argument should be a str or an os.PathLike object where __fspath__ returns a str, not 'int'Wide cell inputs and outputs
These cells produce wide outputs to test that scrollable regions are keyboard-accessible (tab to focus, arrow keys to scroll).
def print_a_really_long_string():
    print("MyST is really really really really really really really really really really really really really really really really really really really really really really really really really really really really really really really really really really really really really really really neat!")
print_a_really_long_string()
MyST is really really really really really really really really really really really really really really really really really really really really really really really really really really really really really really really really really really really really really really really neat!
Multiple outputs
from IPython.display import display
pfig = px.scatter(df, x='A', y='B', width=2500, title='Interactive Scatter Plot with Plotly')
pfig.update_layout(
    xaxis_title='Column A',
    yaxis_title='Column B',
    showlegend=False
)

display(df)
display(pfig)